

Curved space, flat index
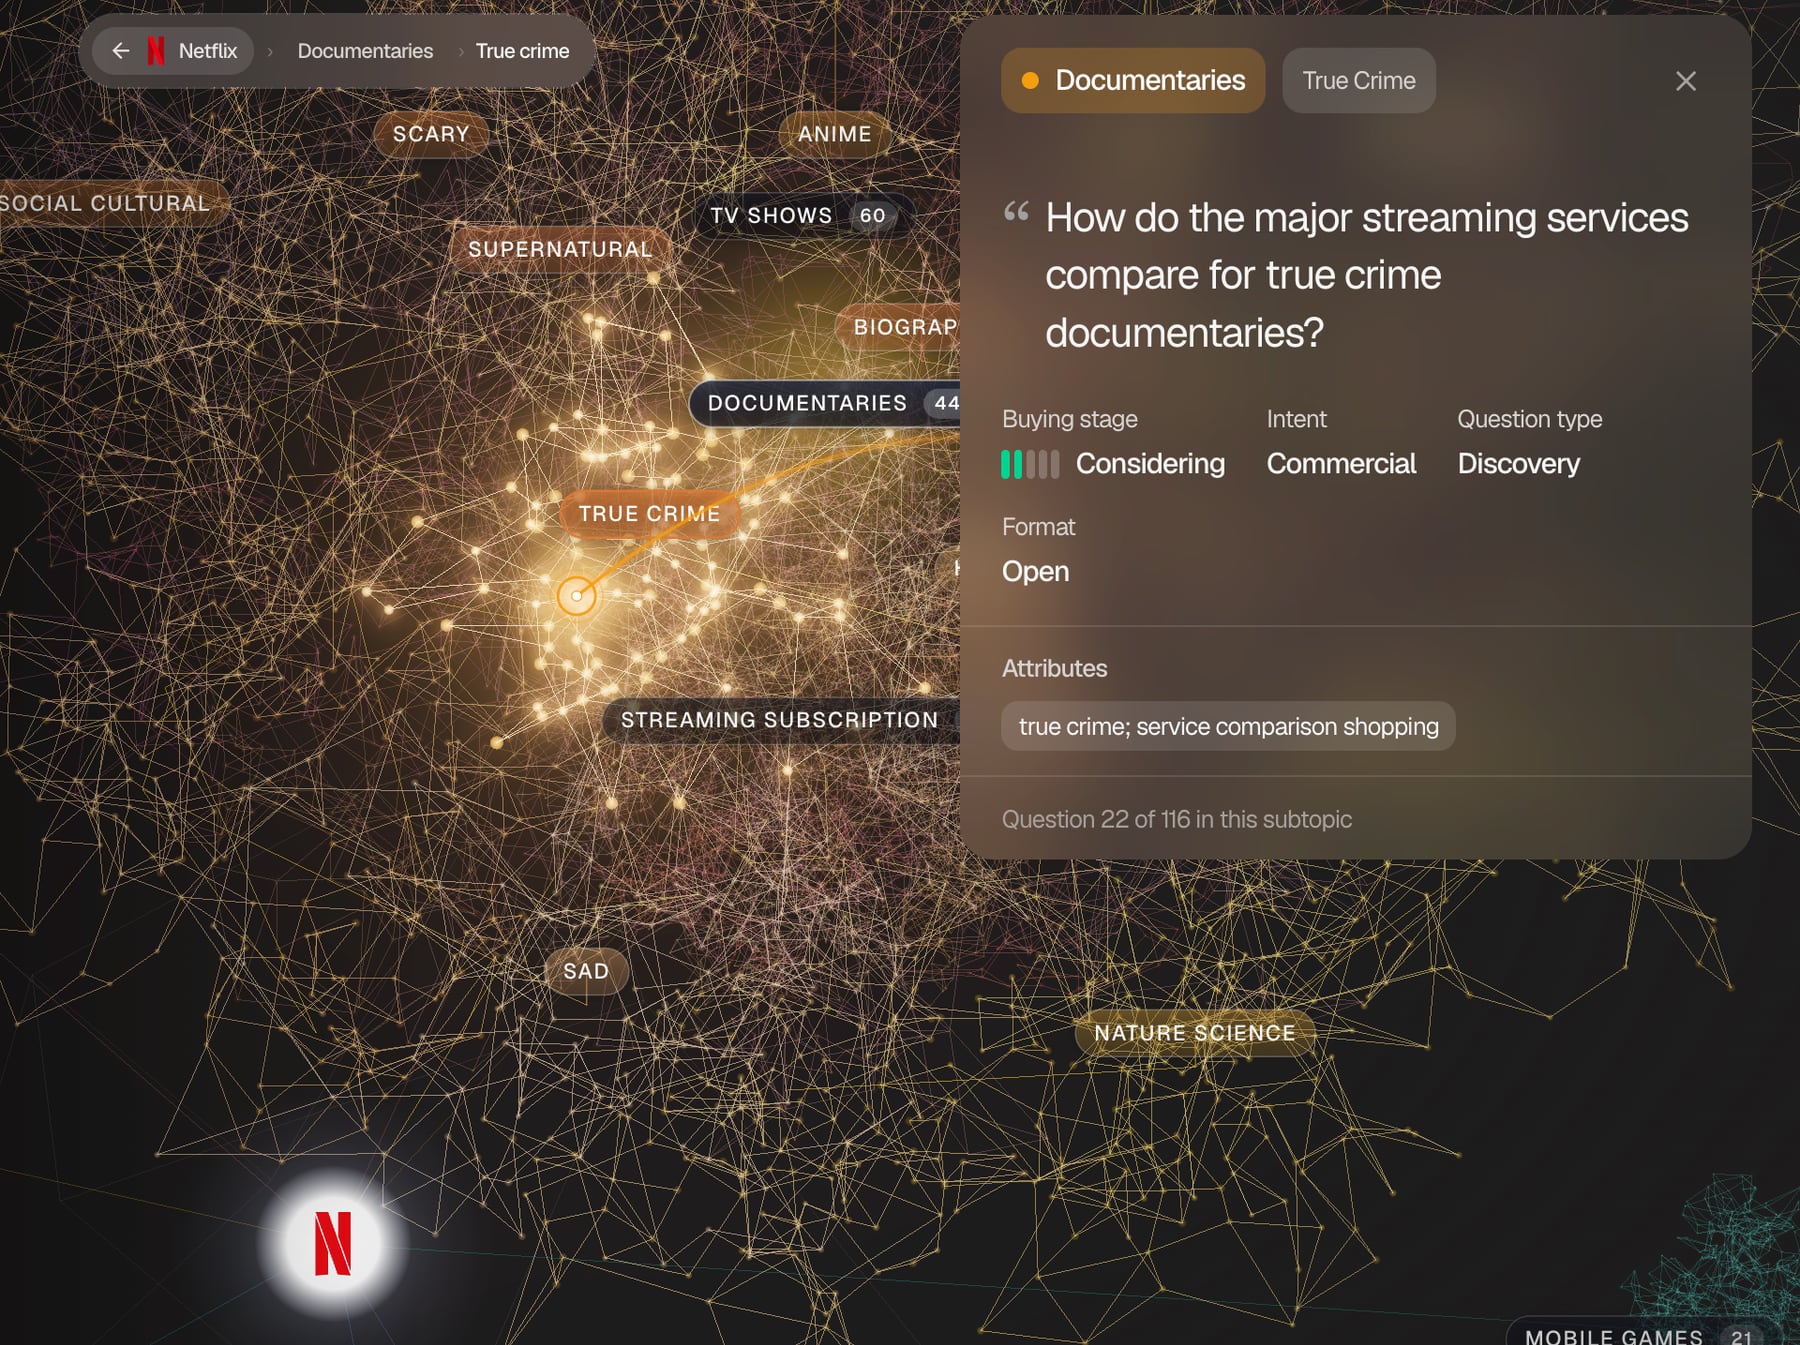
I've spent a lot of time lately looking at a particular kind of picture. A brand sits in the middle. Topics radiate out from it - movies, documentaries, subscriptions, merchandise - and each one opens into a dense cloud of subtopics and the questions people actually ask about them. The further out you go the more crowded it gets, until the outer edges are a solid mat of points you can't pick apart without zooming in.
We build these at Searchable, to help brands understand the breadth of content they'd need to track in AI search to get a complete picture of their visibility. They run to millions of questions across dozens of territories, a single one of which can carry sixty-odd subtopics on its own. I've looked at them enough that the shape has stopped registering as a design decision and started feeling like the obvious way to draw the thing.
Then Qdrant published a piece on hyperbolic embeddings - Matin Mahmood and John Kupchanko, earlier this month - arguing that the shape isn't a drawing convention. It's a claim about geometry, and if you take it seriously it changes what you store.
I came out of it with two things. The first is that the trade on offer is more lopsided than I expected, and that the catch isn't where you'd go looking for it. The second is a question about our own map that I still can't answer: whether it's really the shape this whole idea depends on.
What Qdrant actually showed
The argument is about room.
A tree multiplies as it descends. Each level fans out, so the number of nodes at depth d grows exponentially. Euclidean space doesn't do that: volume in d dimensions grows like r to the power d, which is polynomial in the radius. Push a deep hierarchy into flat space and you eventually run out of somewhere to put things. Branches that ought to be nowhere near each other end up adjacent, because there's nowhere else left to be.
Negatively curved space grows the other way. Area goes like cosh of the radius, which is exponential - move a little further out from the origin and you get a great deal more room. That's the same growth curve the tree has, which is why trees drop into hyperbolic space without a fight.
Growth rates on a common scale, not matching units. Euclidean area within radius r goes as πr², hyperbolic as 2π(cosh r − 1), and a complete tree branching three ways reaches 364 nodes by its fifth level. The shapes are the point: the tree curves away from flat space and tracks the curved one.
The numbers are the fun part. On WordNet, a 5-dimensional Poincaré embedding scores 0.823 MAP against 0.168 for Euclidean at 200 dimensions - forty times the coordinates for a fifth of the quality. On Google's product taxonomy, 5,595 categories across seven levels, it's 0.905 at five dimensions against 0.658 at fifty.
Five dimensions. That's a startling trade, and if the article stopped there it would be a cheerful read.
The number nobody's going to quote
It doesn't stop there, and the thing I'd point everyone at is buried in the limitations.
Run HNSW over those hyperbolic vectors on its own and you get 0.020 recall@10. Not degraded. Not "needs tuning". Effectively nothing.
It's worth sitting with why, because it isn't a bug. An ANN index doesn't store nearness, it stores a graph, and that graph's edges were chosen ahead of time by asking which points are close under some particular metric. Build it with a Euclidean reading of a space whose points don't live in a Euclidean relationship - norms varying across a 600-fold range, in Qdrant's case - and the graph cheerfully wires together things that aren't neighbours at all. Then it walks you confidently to the wrong place. The failure isn't noisy or gradual. The structure is simply wrong.
Their fix works, and it's the sensible one: prefetch a thousand candidates with HNSW under Euclidean distance, then rescore them with real hyperbolic distance, using the identity that acosh(x) is ln(x + sqrt(x² - 1)) so you can compute it without a native operator. Recall@10 goes from 0.266 Euclidean-only to 0.920, and it all stays inside a single server request, which is neat.
The ladder underneath that number is worth seeing, though. At a prefetch of 10, rescoring scores worse than not rescoring at all - 0.257 against 0.266 - because the right neighbours never reach the candidate set to be rescored in the first place. Fifty gets you 0.472, a hundred 0.598, three hundred 0.783, and a thousand 0.920. It is still climbing when the table runs out. Euclidean on its own, meanwhile, sits at 0.266 however many candidates you hand it, because more of the wrong shortlist is still the wrong shortlist.
So look at what that is. You're fetching a thousand candidates to be able to trust ten, because the index can't be trusted to shortlist in the geometry you actually care about.
The index has an opinion
This is where I have to complicate something I've written more than once.
When AWS cut S3 Vectors query pricing I argued that a vector index is a data structure rather than a database, that the raw nearest-neighbour lookup is the commodity slice, and that the interesting value sits in retrieval quality instead. I still think that's right, and this is the case that shows what it leaves out.
Because here the representation win is enormous - forty times fewer coordinates for better results - and the commodity is precisely what stops you banking it. That's the opposite way round from how I've been telling the story.
It's worth being concrete about what "an opinion" means, because it sounds like a figure of speech and isn't. Building an HNSW graph means repeatedly asking which points are nearest to which, and writing the answers down as edges. Those answers are computed once, under one metric, and then frozen. The finished index isn't a container holding your vectors; it's a set of decisions about your vectors, and every later search is a walk over those decisions. Hand it points whose real relationships that metric can't see and you haven't given it difficult data, you've given it a graph wired to the wrong neighbours. It doesn't know. It walks anyway.
Which is why the failure is 0.020 rather than, say, 0.6. There's no partial credit in a structure that was assembled wrong.
So: still a data structure, not a database. But data structures have preconditions, and this one's is a flat space. We've never noticed because everything we've ever swapped between - one model for another, 768 dimensions for 1536, one provider's embeddings for another's - agreed on that precondition without ever being asked.
It gets worse as it gets better
The detail I keep turning over is the one that makes this properly awkward.
Better hyperbolic embeddings push points toward the edge of the Poincaré ball. That's not a defect, it's what good ones do - the boundary is where the fine distinctions live, and a model that's learned the hierarchy properly uses that room. But the Euclidean approximation gets worse out there, because near the boundary a small Euclidean step is an enormous hyperbolic one. So the prefetch gets less reliable exactly where your model got better, and you compensate by fetching more candidates.
Improve the representation, degrade the retrieval approximation, pay for it in prefetch. I can't think of many places in a search stack where quality and serveability pull against each other quite that directly. Usually a better model just helps.
But is it a tree?
Which brings me back to the map, and to the question I'd want answered before trying any of this on our own data.
First, the admission I owe you: our map is a force-directed layout, not a hyperbolic embedding. It comes out looking like a Poincaré projection because it's drawing the same kind of structure under the same pressure - a hub, things branching off it, and not enough room further out - but nothing in it is doing hyperbolic arithmetic. The picture is suggestive, not evidence.
Hyperbolic space buys you exponential room for branching. It is optimal for trees specifically. And the honest thing about our prompt universes is that they aren't trees. They're tree-shaped in places and something messier everywhere else.
Take that Netflix map. "Dark" sits under TV Shows. It's also under Movies. It's under Documentaries too. Same subtopic, three different parents. "Funny" spans TV Shows and Documentaries; "feel-good" spans TV Shows and Movies. The moment a child has several parents you don't have a tree any more, you have a lattice, and a lattice doesn't enjoy the exponential-room advantage in the same way - you're asking a geometry tuned for branching to also handle reconnection.
The attributes make it worse, in an interesting way. A question's place in the topic taxonomy and the kind of question it is are independent of each other. Those cut across the hierarchy rather than hanging off it, and no amount of curvature turns an orthogonal axis into a branch.
Qdrant are careful about this themselves. Their headline numbers measure relationships the embedding already saw in training, and when they asked instead for each category's direct parent - a harder, one-hop question on the same data - it fell to 0.539 MAP. That isn't proof the thing can't generalise. But it is a reminder that the impressive number describes how well the geometry holds a shape it was handed, which is a different question from whether it can work one out.
So the useful question isn't "is my data hierarchical". Nearly everyone's is, a bit. It's which part of my structure is actually a tree, and which part cuts across it. Those probably want different treatment - curved space for the spine, and for the facets the same problem I ran an experiment on a while back, where one point can't sit at the extreme of two independent axes no matter how you bend the space it's in.
What I'd take from this
Two things, and the second is the bigger one.
The first is practical: if you've got a deep taxonomy and you're reaching for a bigger model, five hyperbolic dimensions is at least worth an afternoon before 200 Euclidean ones. Just budget for the rescoring, because the index won't do it for you.
The second is that every retrieval stack has geometry assumptions in it, sitting a level below where anyone normally looks. We talk about which distance we're using as though it were a dropdown, and about swapping embedding models as though it were a config change. Mostly it is, because everything we swap between makes the same assumption. This is what it looks like when something doesn't: not a tuning problem, not a slow decline, but 0.020 and a graph pointing confidently at the wrong neighbours.
Worth knowing which assumptions you're standing on, if only for the day one of them moves.