Elasticsearch "Yellow" cluster status explained
In my last article, I wrote about how to get started running Elasticsearch on EC2. I breifly mentioned the cluster state switching from yellow to green and recieved a comment asking exactly what this meant. I’ve prepared this short post discussing the yellow status, and the Elasticsearch Cluster Health API.
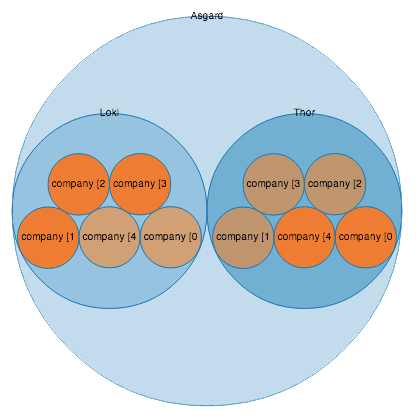
Before I start, let’s recap on some Elasticsearch terminology: an Elasticsearch cluster is made up of one or more nodes. Each of these nodes contains indexes which are split into multiple shards. Elasticsearch makes copies of these shards called replicas. These (primary) shards and replicas are then placed on various nodes throughout the cluster.
Got it? Great.
To check the health of your cluser, we can use the Cluster Health API.
curl -XGET http://localhost:9200/_cluster/health?pretty=true

    {
      "cluster_name" : "asgard",
      "status" : "yellow",
      "timed_out" : false,
      "number_of_nodes" : 1,
      "number_of_data_nodes" : 1,
      "active_primary_shards" : 5,
      "active_shards" : 5,
      "relocating_shards" : 0,
      "initializing_shards" : 0,
      "unassigned_shards" : 5
    }
Elasticsearch provides a handy "traffic lights" classification of cluster health. Here is a simple explanation of each of the options.
RED: Damnit. Some or all of (primary) shards are not ready.
YELLOW: Elasticsearch has allocated all of the primary shards, but some/all of the replicas have not been allocated.
GREEN: Great. Your cluster is fully operational. Elasticsearch is able to allocate all shards and replicas to machines within the cluster.
Currently, our cluster health is yellow, meaning shard replicas have not been allocated. Why is this? This is because the current cluster only consists of a single node, so the replicas remain unasigned simply because no other node is available to contain them. We can fix this by adding another node to the cluster - If you’re unsure about how to do this then follow the steps in my previous article. This new node will join your cluster, and ElasticSearch will begin allocating replica’s to it. I always like to watch this process in BigDesk, as it visually shows the replicas copying accross to the new node. Once ElasticSearch has finished copying and allocating all of the replica shards, take a look at the cluster health again:
curl -XGET http://localhost:9200/_cluster/health?pretty=true

    {
       "cluster_name":"asgard",
       "status":"green",
       "timed_out":false,
       "number_of_nodes":2,
       "number_of_data_nodes":2,
       "active_primary_shards":5,
       "active_shards":10,
       "relocating_shards":0,
       "initializing_shards":0,
       "unassigned_shards":0
    }
Win. As expected the cluster state is now reported as green. If you take a look at your cluster in BigDesk you will be able to see the differnt nodes with the shards and replicas distributed accross them.
So there's a quick explanation of what yellow status is. When the cluster is yellow, everything is OK however your replica rules are not satisfied: Requests can still be handled successfully, but if ever your server completly fails (and corrupts), you risk losing some of your documents if you havn't got a replica of the data elsewhere in the cluster. The status will update to green once your cluster contains enough nodes to allocate the replicas, or when you adjust the index replica settings.